Crypto order flow indicator: see who is buying and selling
A crypto order flow indicator shows the orders behind each candle. So instead of guessing from price alone, you see who is pushing right now.
This guide explains the main order flow tools in plain English. It also shows which ones help beginners, and the one filter that makes bubbles useful.
- A crypto order flow indicator shows the orders behind each candle, as they happen.
- Big order bubbles appear live, so they never repaint.
- Raise the minimum bubble size, and then only the largest orders remain.
- Above all, use order flow to confirm a signal, not to replace it.
What order flow means
Every trade has a buyer and a seller. However, one side is usually in a hurry. So that side uses market orders and pushes price.
Basically, order flow tracks that pushing side. For example, if big market buys keep hitting, buyers are in control. On the other hand, if big buys hit and price does not rise, someone is quietly selling into them.
In short, price charts show the result. By contrast, order flow shows the fight behind it.
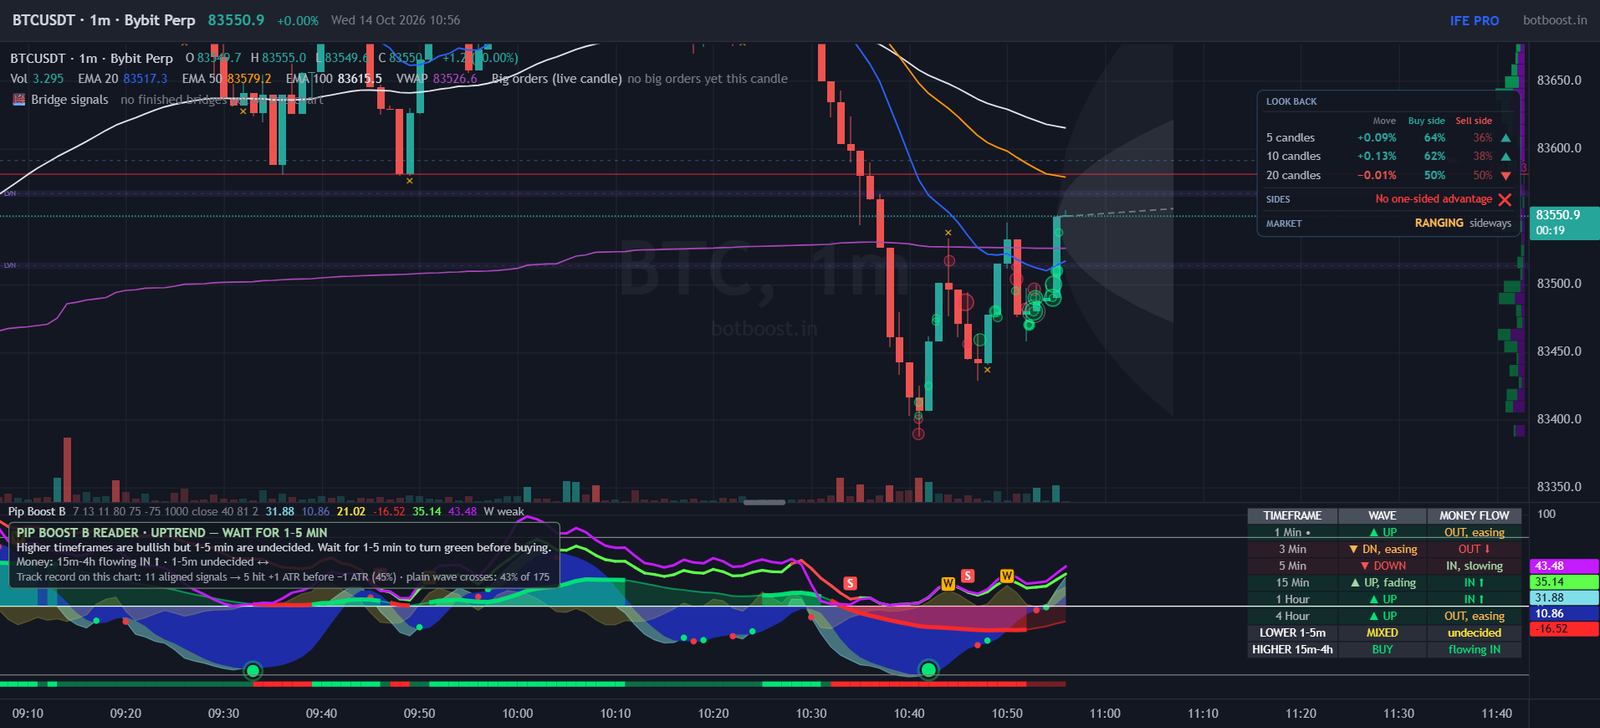
Tools inside the crypto order flow indicator
| Tool | What it shows |
|---|---|
| Big order bubbles | Large market orders, drawn the instant the exchange prints them |
| Delta | Buy volume minus sell volume in each candle |
| Footprint | Buying and selling at each price inside a candle |
| Order book | Waiting limit orders above and below price |
| Open interest | How many futures positions are open |
Also, all of them read live exchange data. So the bubbles appear in real time, and they never repaint.
How to read big order bubbles
Bubbles are the easiest place to start, because each bubble is one large aggressive order. Its size shows how big it was, and its colour shows whether it was a buy or a sell.
Still, a busy chart can show hundreds of bubbles. Yet most of them are noise. So use the minimum bubble size slider and raise it until only the largest orders remain.
Then look for two patterns:
- Push: big bubbles in the direction of the move, and price follows. The move is real.
- Stall: big bubbles hit, yet price does not move. Someone is absorbing them.
The stall is the more useful signal. In fact, our absorption trading guide explains it in detail.
Trading Armour draws the entry, stop loss and two take profit targets on every signal. Also, it runs in your browser for Bybit and Binance futures.
Using a crypto order flow indicator with signals
In general, order flow works best as a second opinion. So start with a closed-candle BUY or SELL, and then check the flow.
- A BUY prints on the chart.
- Next, big buy bubbles appear near the entry, and price holds.
- Meanwhile, delta stays positive.
- Then the setup has support from real buyers, so it is stronger.
However, if big sell bubbles keep hitting right after a BUY, be careful. In that case, waiting one more candle is cheap insurance.
Which order flow tools to ignore at first
Beginners often turn everything on. As a result, the chart becomes unreadable. Instead, start with just two tools: bubbles with a high minimum size, and delta.
Later, add the order book and the footprint. Also, the Beginner view button hides everything except candles, volume, moving averages, VWAP and signals. So you can switch back to a clean chart at any moment.
Limits of order flow
Order flow shows one exchange at a time, so it never sees the whole market. In addition, large traders split and hide orders. Therefore, treat each bubble as a clue, not a promise.
For more on how big players trap stops, also read our guide to stop loss hunting. Finally, you can see every order flow tool on the features page.
Crypto order flow indicator questions
Do order flow bubbles repaint?
No. Each bubble is drawn the moment the exchange prints the trade, and it stays there. Live data cannot be changed after the fact.
Why does my chart show too many bubbles?
Raise the minimum bubble size slider. Then only the largest orders stay on the chart, and the useful ones stand out.
Is order flow good for beginners?
Yes, if you keep it simple. Start with big order bubbles and delta, and use them only to confirm a signal you already have.
- Absorption trading in cryptoWhen big orders hit but price refuses to move, someone is absorbing them.
- Stop loss hunting in cryptoWhy your stop gets hit before price turns, and where to place it instead.
- Crypto liquidation levelsWhere leveraged traders get forced out, and why price is drawn there.
- Bybit scalping indicatorSignals, order flow and real stops, all built for Bybit USDT perpetuals.